Data Visualization / R (ggplot2, plotly) Python (matplotlib, plotly)
Data / Data Visualization- 7 days
 Buy For
50.00 USD
Buy For
50.00 USD
Request Custom Offer
Request Custom Offer


 Earn A 10% Commission By Sharing This Service!
Use This URL Shortener to Share Affiliate Link:
- You may share your Affiliate Link on Facebook, YouTube, Twitter, forums, articles or blogs.
- Anyone who clicks this link will be tagged with your cookie and you will make 10% of whatever they buy on Zeerk.
- The cookie stays forever!
- You can even just send friends to the Zeerk home page and get 10% on anything they stumble upon and buy!
Job Description
Are you looking for expert assistance with data visualization? I offer services to meet your needs, including:
Bar Graphs:
- Simple Bar Graph
- Grouped Bar Graph
- Stacked Bar Graph
- Clustered Bar Graph
- 100% Stacked Bar Graph
- Lollipop Chart (Bar and Dot Plot)
- Floating Bar Graph
- Error Bar Graph
- Pareto Chart (Combination of Bar and Line Graph)
- Radial Bar Graph
- Gantt Chart (Bar Graph in Project Management)
Line Graphs:
- Simple Line Graph
- Multiple Line Graph
- Stacked Line Graph
- Area Chart (Line Graph with Filled Area)
- Streamgraph (Area Chart for Time Series)
- Step Line Graph (Line Graph with Stepwise Connections)
- Spline Graph (Smoothed Line Graph)
- Error Line Graph
- Sparkline (Small Line Graph without Axes)
- Radar Chart (Line Graph in a Circular Format)
- Lorenz Curve (Line Graph Used in Economics)
Pie Chart:
- Exploded Pie Chart
- 3D Pie Chart
- Donut Chart (Pie Chart with a Hole in the Center)
- Nested Pie Chart
- Polar Area Chart (Pie Chart in Polar Coordinates)
Area Graphs:
- Simple Area Graph
- Stacked Area Graph
- 100% Stacked Area Graph
- Streamgraph (also known as ThemeRiver)
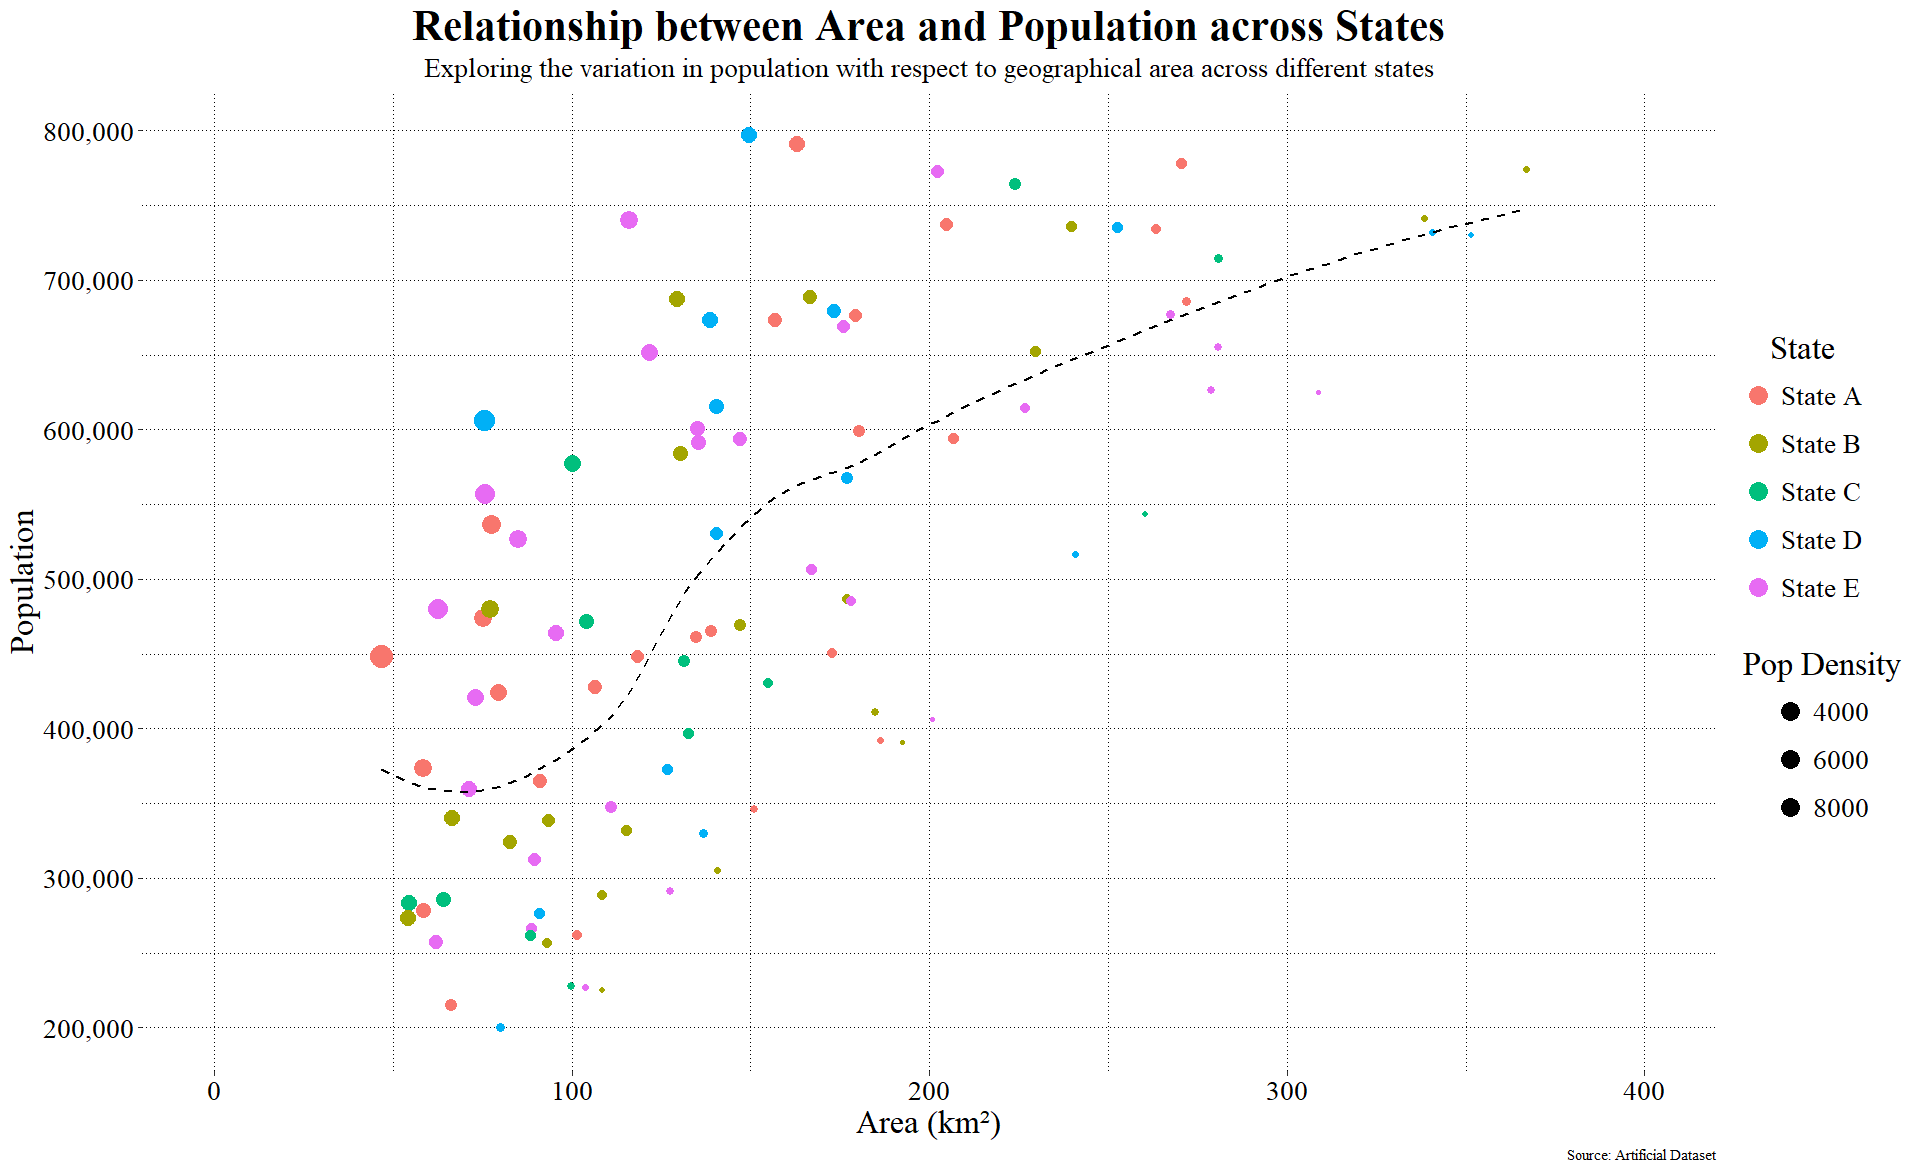
Scatter Plots:
- Simple Scatter Plot
- Bubble Chart (Scatter Plot with Bubble Sizes)
Histograms:
- Simple Histogram
- Cumulative Histogram
Box Plots:
- Simple Box Plot
- Notched Box Plot
- Violin Plot (Combination of Box Plot and Kernel Density Plot)
Heatmaps:
- Simple Heatmap
- Correlation Heatmap
- Hierarchical Heatmap
Polar Charts:
- Polar Area Chart (Already mentioned under Pie Charts)
- Radar Chart (Already mentioned under Line Graphs)
Waterfall Charts:
- Simple Waterfall Chart
- Bridge Chart (Used in Finance and Economics)
Funnel Charts:
- Simple Funnel Chart
- Inverted Funnel Chart
Treemaps:
- Squarified Treemap
- Voronoi Treemap
Network Diagrams:
- Force-Directed Graph
- Chord Diagram
Bullet Graphs:
- Simple Bullet Graph
- Vertical Bullet Graph
Word Clouds:
- Tag Cloud
- Phrase Cloud
Sparklines:
- Line Sparkline
- Column Sparkline
Why Choose My Services?
- Expertise: I have extensive experience in data visualization and a deep understanding of various visualization techniques.
- Accuracy: Ensuring precise and reliable results is my top priority. I follow the good practice in statistics.
- Customization: I tailor my approach to meet your specific needs and research questions.
- Communication: Clear and detailed explanations of the results, making the analysis easy to understand.
Whether you need a regression analysis, non-parametric test, or some other statistical service, I'm here to help. Let's work together to achieve your research and data analysis goals!
Report this job
Order Additional
Other jobs by Josip

Last seen: 2 weeks ago
Send this to a friend